006.【Python Basics】 Check Results with a Graph
📈 See the Results Visually with Python
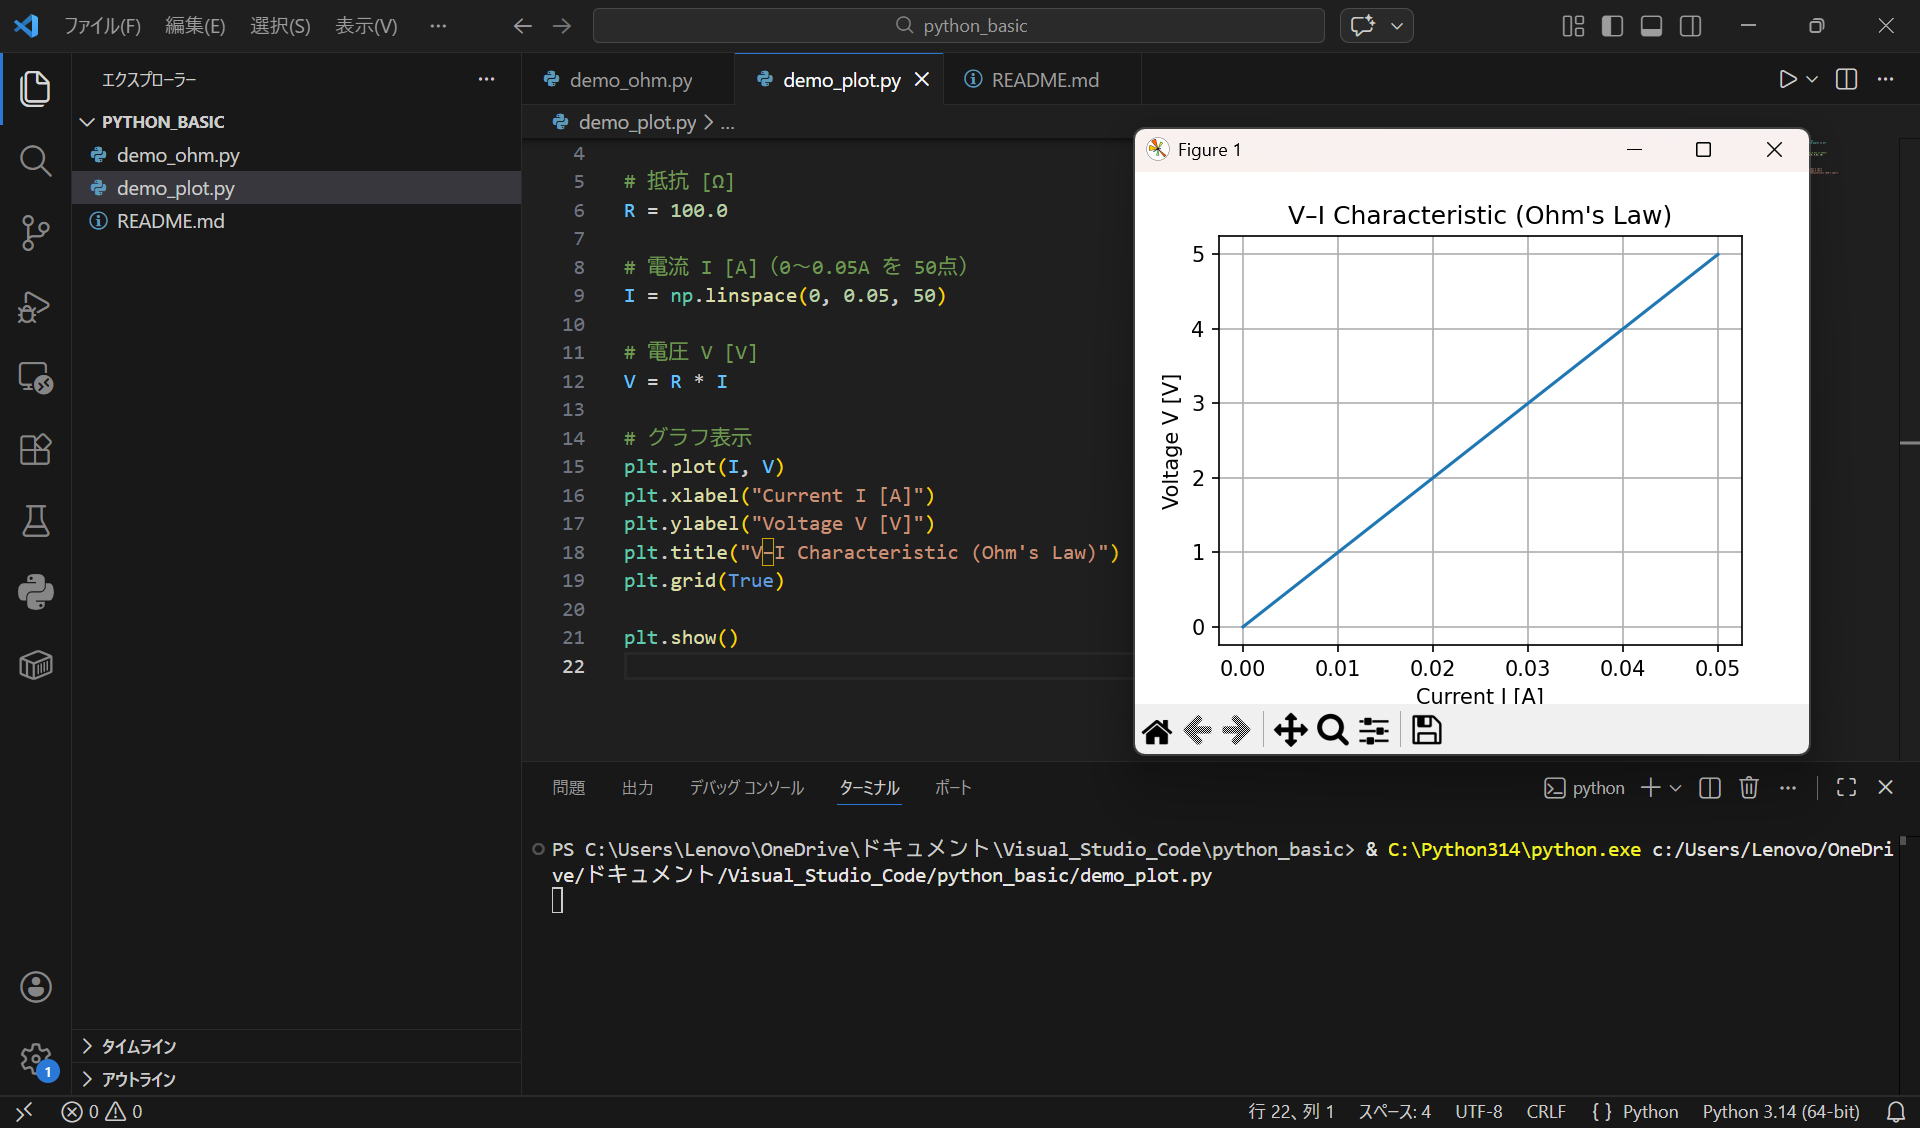
Calculation results become
clear at a glance when shown as a graph.
Here, we
visualize the V–I characteristic using a graph.
✅ What You Can Do
- Display calculation results as a graph
- Understand behavior visually
- Run everything directly in VS Code
⚡ Demo: Plotting the V–I Characteristic
import numpy as np
import matplotlib.pyplot as plt

R = 100.0

I = np.linspace(0, 0.05, 50)
V = R * I

plt.plot(I, V)
plt.xlabel("Current I [A]")
plt.ylabel("Voltage V [V]")
plt.title("V–I Characteristic (Ohm's Law)")
plt.grid(True)

plt.show()
▶ Running Example
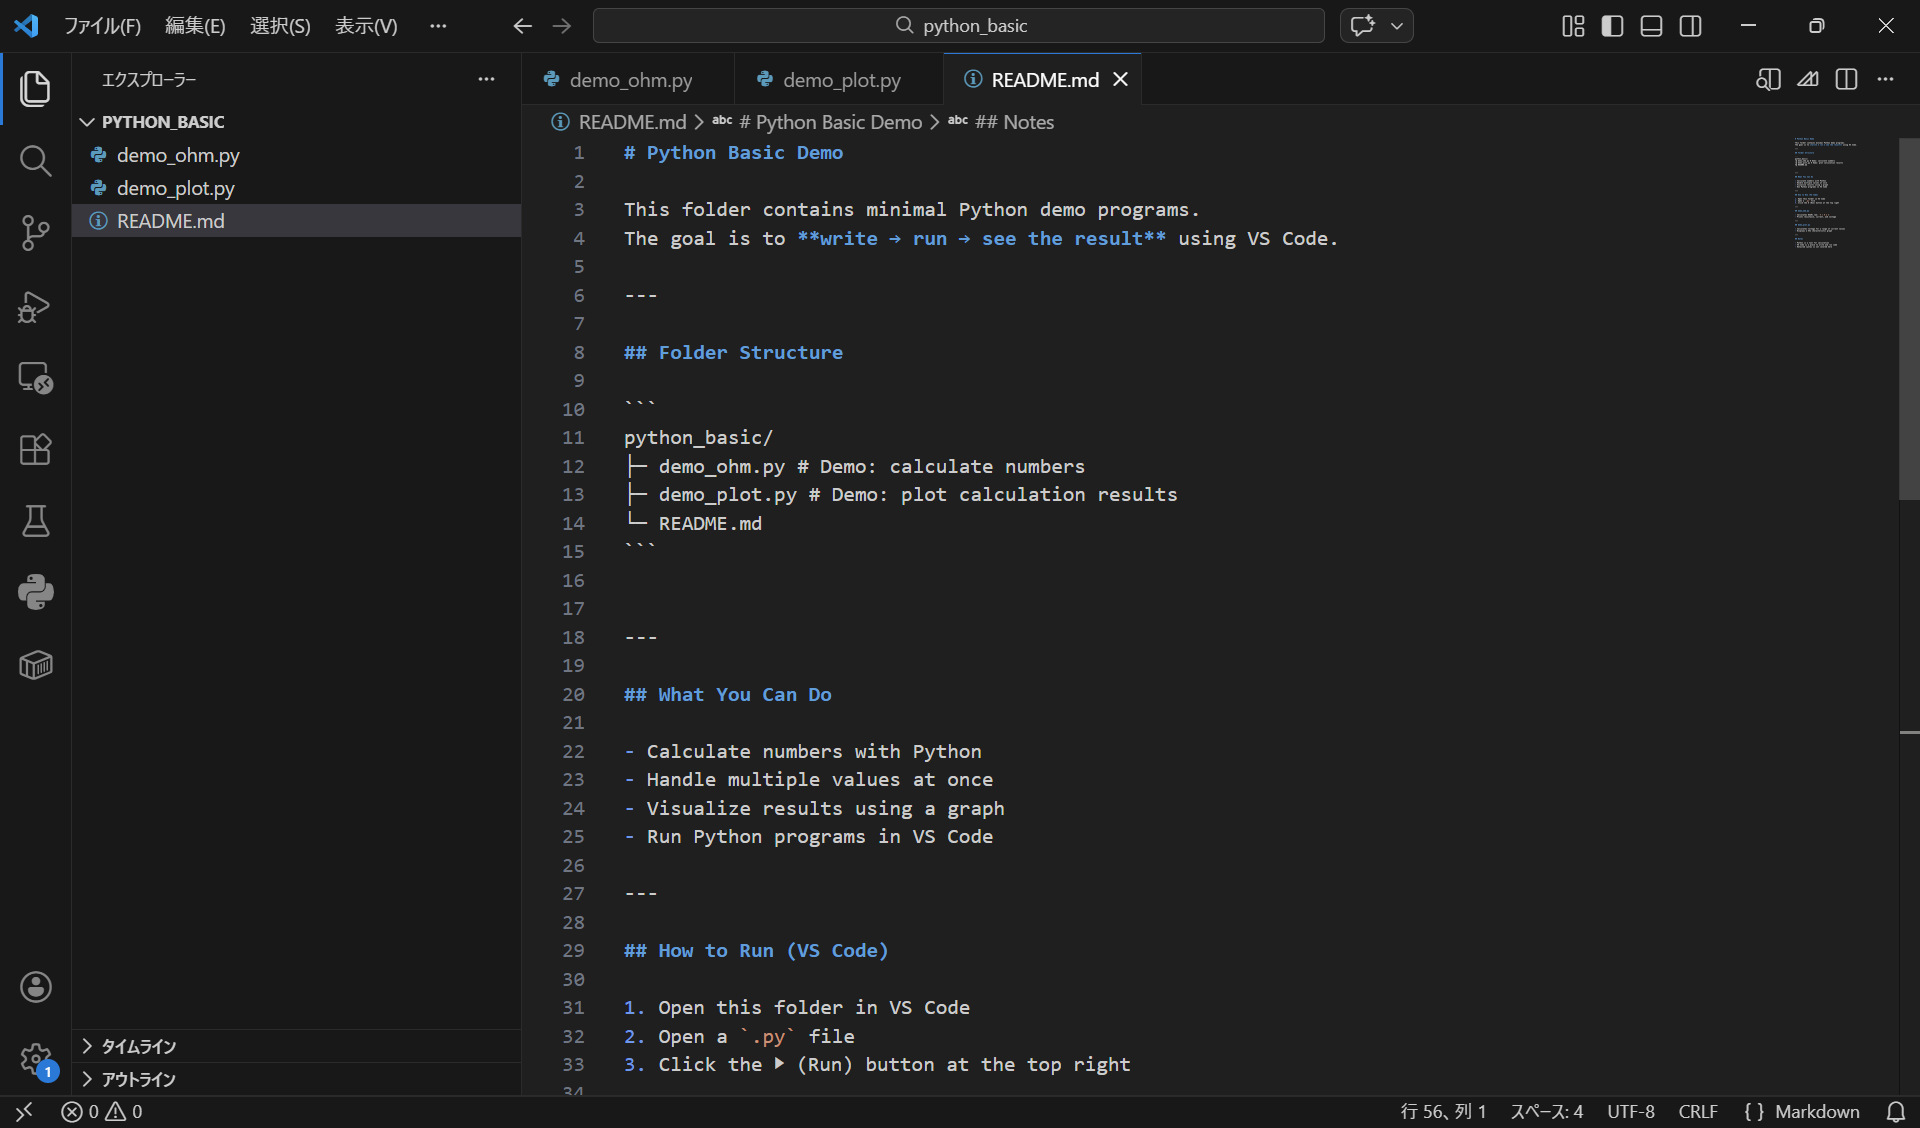
📄 Notes from README
A README.md file is included in the folder,
which explains only:
- What you can do
- How to run the code
💡 Key Points
- Calculate → Run → Visualize is one continuous flow
- Graphs help you understand behavior intuitively
- VS Code is your workspace
📝 Summary
- Python is useful not only for calculation, but also for verification
- Visualizing results makes understanding faster
This is enough for Python basics.