🧩 mems-ana_demo
d33-dominant MEMS piezoelectric hysteresis visualization
This directory contains a frozen demo snapshot 🧊 that visualizes the quasi-static
out-of-plane displacement of a MEMS piezoelectric structure dominated by the
piezoelectric coefficient d33, driven by a ferroelectric P–Ez hysteresis loop.
🎯 Purpose
This demo is not intended for quantitative device design.
Instead, it provides a clear, reproducible reference showing how:
⚡ Electrical hysteresis → 🛠 Mechanical displacement patterns
are mapped under a simplified, d33-dominant assumption.
🔗 Links
| Language | GitHub Pages 🌐 | GitHub 💻 |
|---|---|---|
| 🇺🇸 English |
1️⃣ Electrical input: P–Ez hysteresis (V-only)
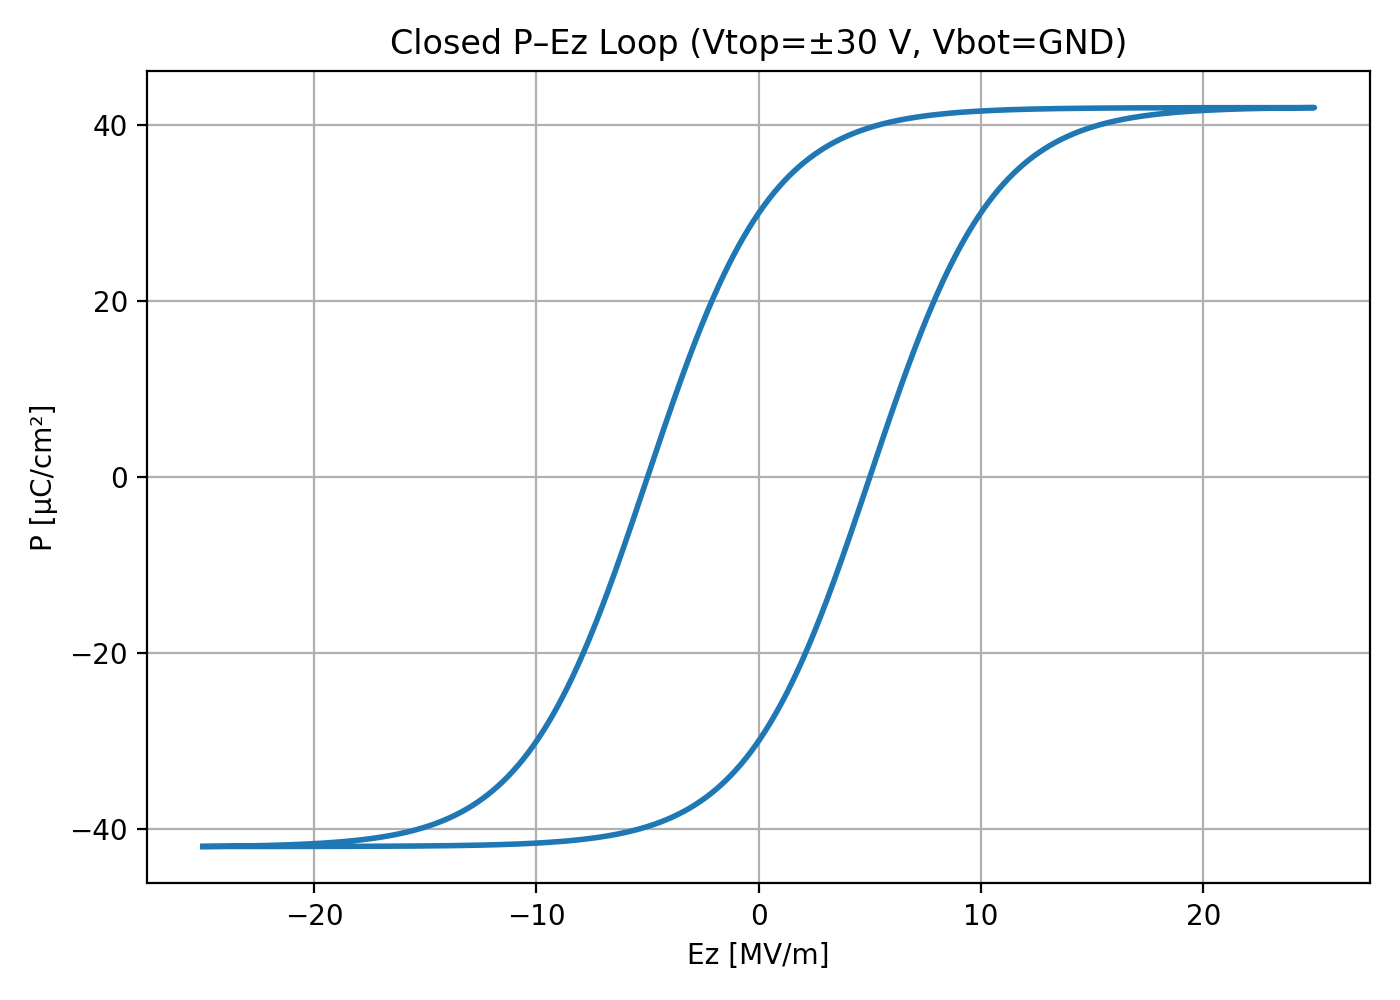
This figure shows the polarization–electric field (P–Ez) hysteresis loop
used as the electrical input to the model.
🔹 Key assumptions:
- 🔌 Voltage-driven only
- 🚫 Electrical current and dynamic switching effects are not modeled
- 🔁 Rising / falling voltage branches are explicitly defined
This hysteresis loop is imposed as a fixed, common input condition
for all subsequent mechanical results.
2️⃣ uₙ–V butterfly curve (d33-dominant, fixed scale)
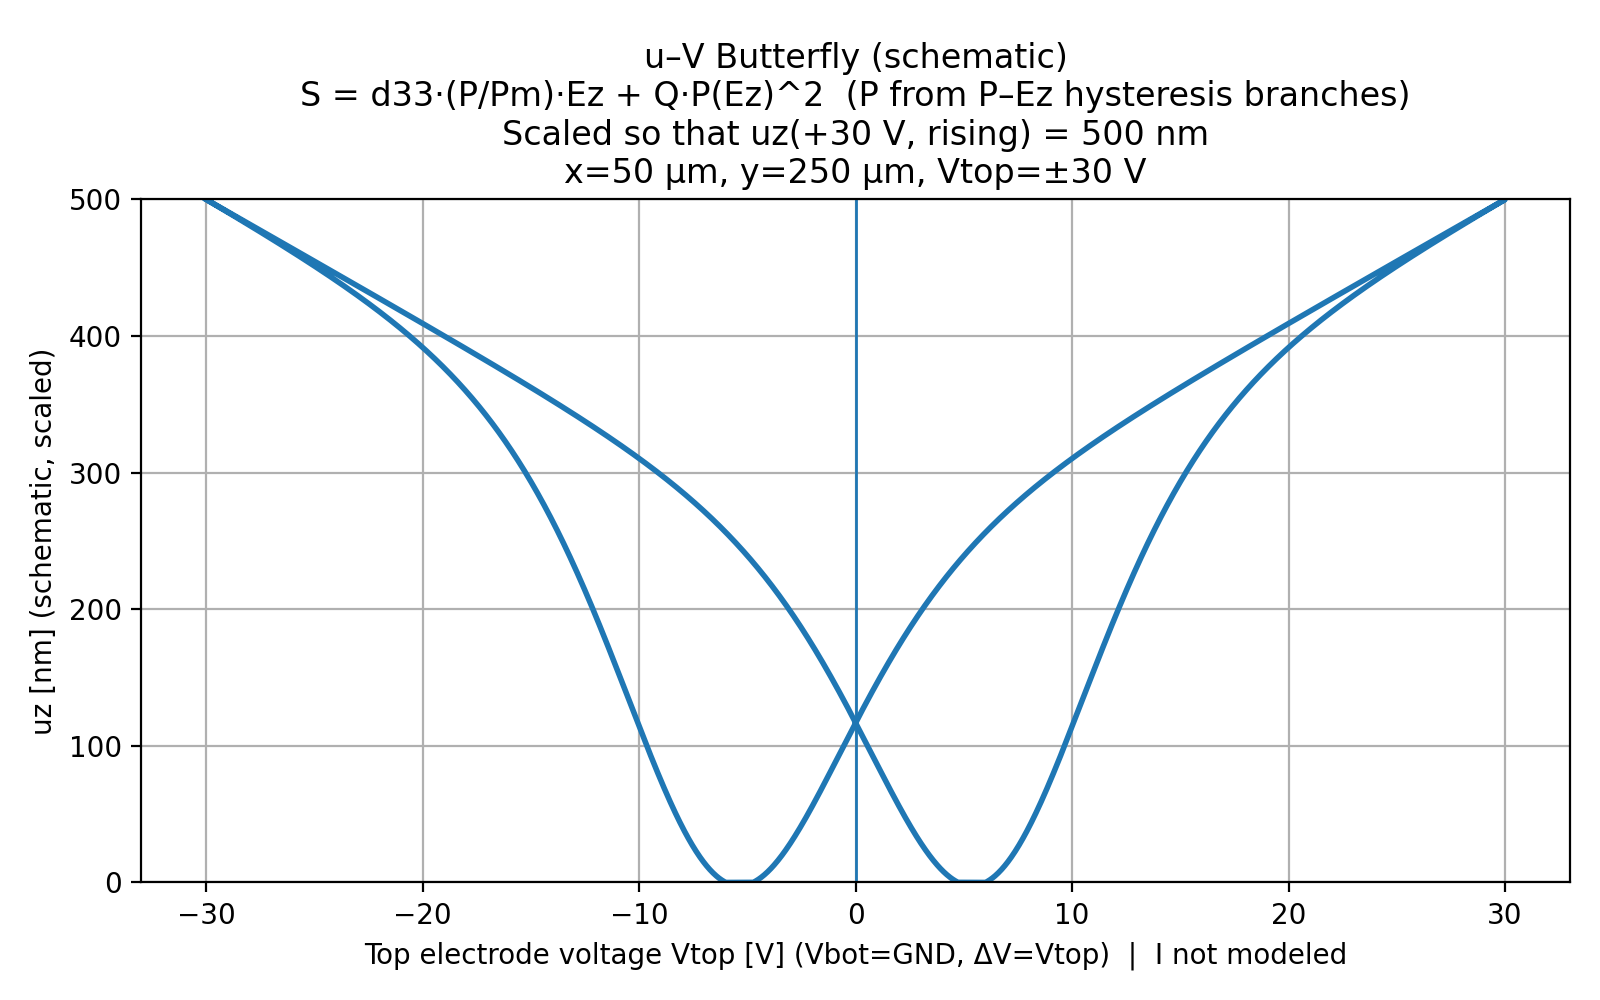
This plot shows the resulting butterfly-shaped displacement–voltage response
derived from the P–Ez hysteresis under a d33-dominant assumption.
📐 Axes definition:
- Vertical axis: out-of-plane displacement $u_z$
- Horizontal axis: applied voltage
🎨 Visualization policy:
- Color / scale range is fixed to 0–500 nm
- Enables direct comparison across operating points
The butterfly shape directly reflects the underlying ferroelectric hysteresis.
3️⃣ Static uₙ(x, y) mid-plane maps
(absolute displacement)

These snapshots show the spatial distribution of $u_z(x,y)$ at the MEMS
mid-plane for selected voltage points along the butterfly curve.
🧭 Modeling notes:
- Displacement is treated as ABSOLUTE $u_z$
- A non-zero offset at 0 V is allowed
- Mechanical boundary conditions are schematic / conceptual
📊 All frames share the same color scale (0–500 nm)
to preserve visual consistency and comparability.
4️⃣ Dynamic response
uₙ(x, y) over voltage cycles
This animation illustrates the time evolution of $u_z(x,y)$
over multiple voltage cycles following the hysteresis loop.
⏱ Characteristics:
- Rising / falling branches follow the P–Ez loop explicitly
- Response is quasi-static (no inertia, no damping)
- Intended for intuitive understanding, not transient accuracy
▶️ How to run
python -m pip install -e .
python examples/animate_uz_midplane_typical_d33.py
📌 Scope and limitations
- 🔌 Voltage-driven analysis only (current not modeled)
- 📐 d33-dominant piezoelectric response
- 🚫 No losses, no nonlinear elasticity
- 🔩 No realistic anchors or packaging constraints
- 🧩 Boundary conditions are simplified for clarity
🧊 Status
- Stable
- Frozen demo snapshot
- All parameters are fixed for reproducibility
⚠️ Disclaimer
This demo is intended for conceptual understanding and visualization only.
Real device design and quantitative evaluation require additional physics, including:
- Electrical current and losses
- Nonlinear and rate-dependent mechanics
- Realistic boundary and anchoring conditions
- Full electromechanical coupling
Use this demo as a reference visualization, not a design authority.