📘 PZT P–E Loop Playground
A lightweight modeling and visualization toolkit for exploring PZT polarization behavior
(Samizo-Lab / TCAD Pre-Analysis Sandbox)
Links
| Language | GitHub Pages 🌐 | GitHub 💻 |
|---|---|---|
| 🇺🇸 English |
📌 Overview
This repository provides a Python-based playground for exploring how three key factors:
- Film Thickness
- Composition (Zr/Ti ratio)
- Annealing Temperature
affect the polarization behavior of PZT ferroelectric films, including:
- P–E Hysteresis Loops (closed-loop generation)
- P–V conversion (device-level)
- Thickness variation
- Composition variation (Zr-rich ↔ Ti-rich)
- Annealing temperature variation
- 3D/Contour mapping of Pm
- S–E Butterfly Curves
The goal is rapid exploration using simplified physical models, serving as a conceptual bridge toward full TCAD simulations.
📁 Repository Structure
tcad_playground_pzt/
│
├── fig/                           # All generated figures
│   ├── pzt_pe_hysteresis_1d.png
│   ├── pzt_pe_tvar_PE.png
│   ├── pzt_pe_tvar_PV.png
│   ├── pzt_pe_hysteresis_compvar_1d.png
│   ├── pzt_pe_hysteresis_annealvar_1d.png
│   ├── pzt_pm_surface.png
│   ├── pzt_se_butterfly_1d.png
│   └── ...
│
├── pzt_pe_hysteresis_1d.py           # Base P–E closed-loop model
├── pzt_pe_hysteresis_tvar_1d.py      # Thickness variation
├── pzt_pe_hysteresis_compvar_1d.py   # Composition variation
├── pzt_pe_hysteresis_annealvar_1d.py # Anneal temperature variation
├── pzt_pm_surface_3dmap.py           # Pm 3D surface map
├── pzt_se_butterfly_1d.py            # S–E butterfly curve
│
└── README.md
🔧 Requirements
Python 3.8+
numpy
matplotlib
scipy
▶ Usage
1. Generate a basic P–E hysteresis loop
python pzt_pe_hysteresis_1d.py
Output image:
fig/pzt_pe_hysteresis_1d.png
📈 Generated Figures (Examples)
■ P–E Hysteresis Loop
Parameters:
- Pm = 42 µC/cm²
- Pr = 30 µC/cm²
- Es auto-calculated from Pr
Example image: pzt_pe_hysteresis_1d.png
■ Thickness Variation → P–V Curve
Thicknesses: 1.0 / 1.2 / 1.4 µm
- P–E curve remains nearly unchanged
- P–V curve shifts due to voltage scaling (V = E·t)
Example: pzt_pe_tvar_PV.png
■ Composition Variation
Composition values:
- −0.10 (Zr-rich)
- 0.00 (Nominal)
- +0.10 (Ti-rich)
Modeled trend: Ti-rich → Higher Pm
Example: pzt_pe_hysteresis_compvar_1d.png
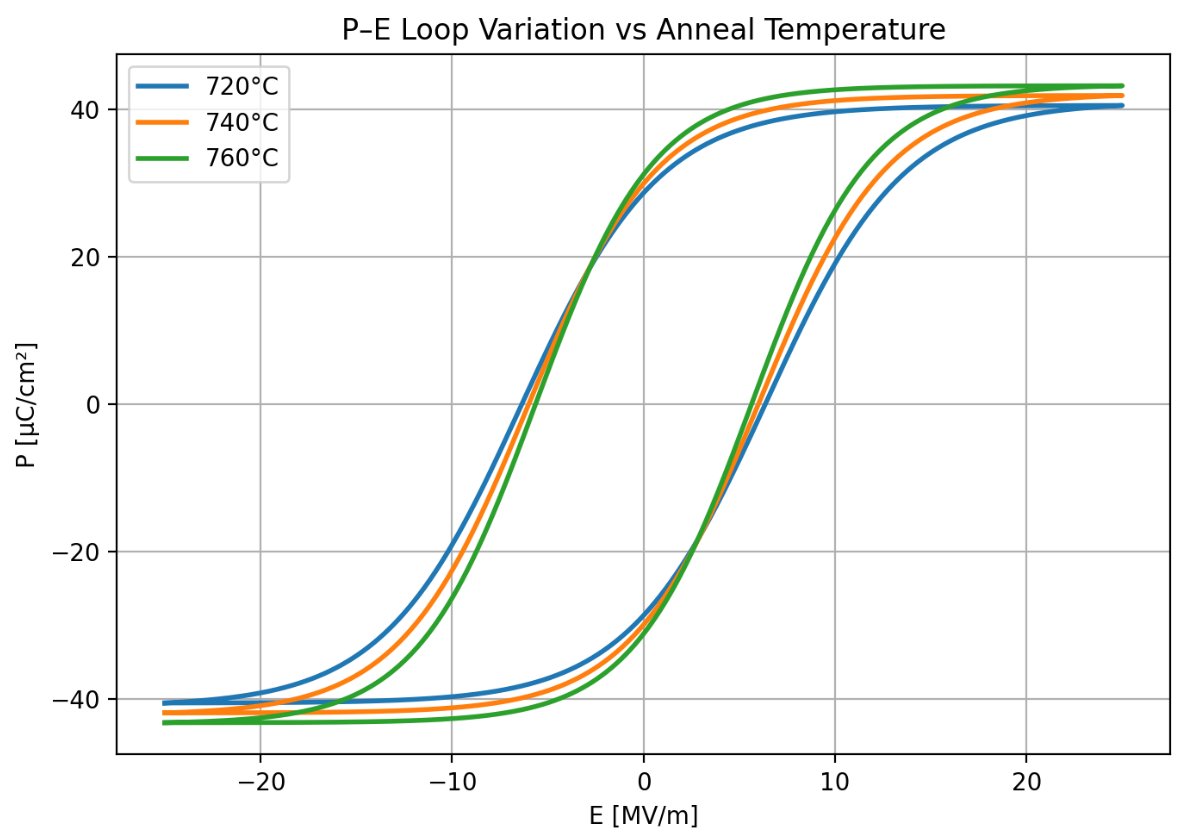
■ Annealing Temperature Variation
Anneal temps: 720 / 740 / 760 °C
Modeled trend: Peak Pm near 740 °C
Example: pzt_pe_hysteresis_annealvar_1d.png
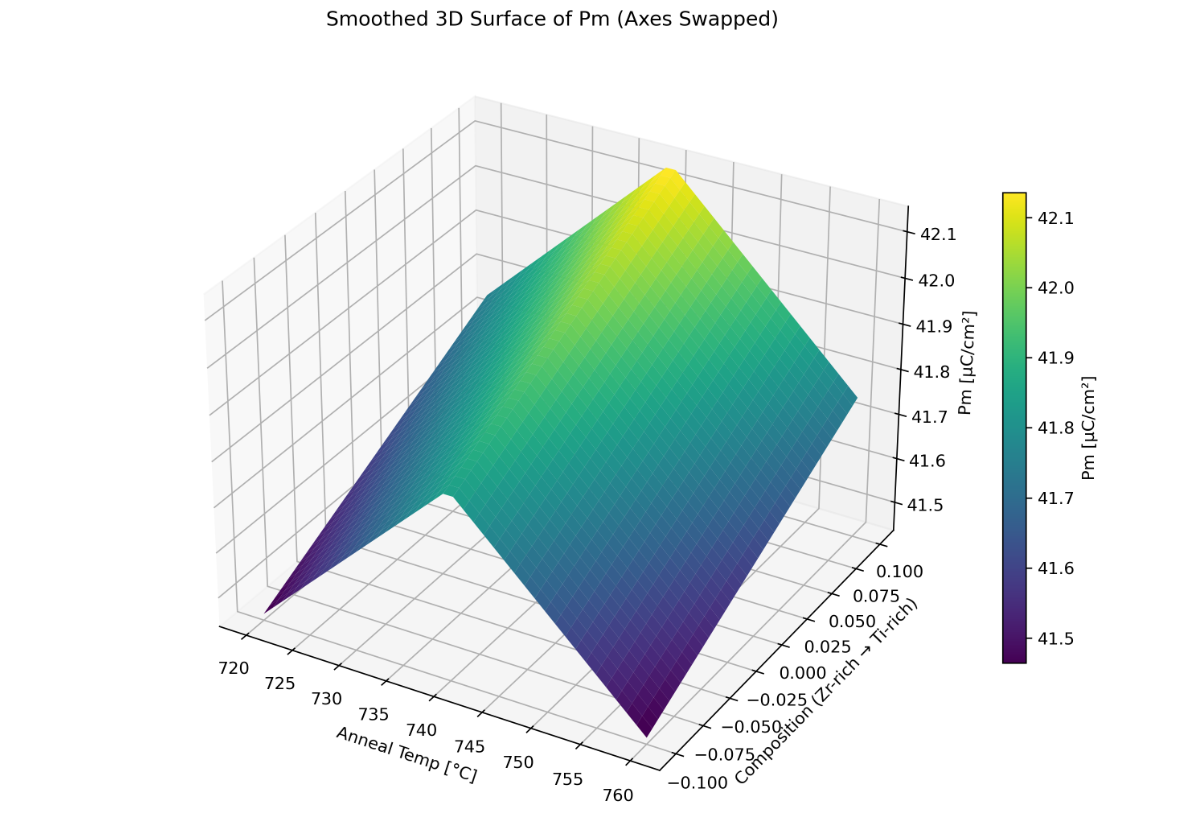
■ Pm 3D Surface Map (Composition × Anneal Temp)
Smooth surface + contour map of Pm.
Example: pzt_pm_surface.png
■ S–E Butterfly Curve
Model:
- d₃₃ = 200 pm/V
- S = d₃₃ × E × sign(P)
Generates a classic butterfly curve.
Example: pzt_se_butterfly_1d.png
🧩 Modeling Philosophy
This sandbox focuses on exploratory modeling, not high-fidelity TCAD:
- No fitting to real measurements (optional future step)
- Intuitive exploration of 3-factor interactions
- Flexible control of Pm, Pr, Ec, Es
- Ready for extensions:
- Pm(T)
- Ec(Composition)
- Finite-thickness effects
- dP/dE differential modeling
- Domain-switching physics
Workflow matches Samizo-Lab methodology: Exploration → Model Formulation → Experiment Fit → TCAD Linkage
📌 Future Work
- Curve fitting using experimental data
- Parameter bridging to COMSOL / Synopsys TCAD
- Integration of domain-switching physics
- D–E formulation support
- Fatigue & imprint modeling
🏁 Conclusion
- Visualizes how Thickness, Composition, and Anneal Temperature influence
P–E, P–V, and Pm characteristics - Supports design-space exploration before experiments or TCAD runs
- Provides a lightweight, flexible modeling environment for Samizo-Lab workflows
📈 Example Figures (PZT Ferroelectric Playground)
Below are sample outputs generated from the tcad_playground_pzt module,
illustrating how film thickness, composition, and annealing temperature
influence ferroelectric polarization behavior.
▶ P–E Hysteresis Loop (Anneal Temperature Variation)
This example shows how the polarization–electric field hysteresis loop shifts
with annealing temperature. A peak polarization typically appears near the
optimal crystallization temperature.
▶ Pm 3D Surface Map (Composition × Anneal Temperature)
A smooth 3D visualization of the spontaneous polarization ( P_m ),
sweeping both annealing temperature and composition (Zr/Ti ratio).
This helps explore design spaces prior to TCAD or experimental work.
▶ S–E Butterfly Curve (Strain–Electric Field)
The classic butterfly-shaped strain–electric field curve,
modeled using a simplified piezoelectric formulation:
Illustrates the nonlinear electromechanical response of PZT films.

👤 Author
| Item | Details |
|---|---|
| 👨🔬 Name | Shinichi Samizo |
| 💻 GitHub | Samizo-AITL |
📄 License
| Component | License | Notes |
|---|---|---|
| 💻 Source Code | MIT License | Free use / modification |
| 📄 Text Materials | CC BY 4.0 / CC BY-SA 4.0 | Attribution required |
| 🎨 Figures & Diagrams | CC BY-NC 4.0 | Non-commercial only |
| 🔗 External References | Original license | Proper citation required |